Your-Marketing-ToolkitSM
Partial List of Charts, Tables, and
Dashboards
The following is a partial list of typical
charts, tables and Dashboards that are used in Your-Marketing-Toolkit. Note
that additional charts are prepared for special and unique measures and
issues. Each of these charts represent a
family of presentations that are modified by options uniquely associated with
the each chart, by changes in the selection of groups of respondents to be
considered, and the selection of variables and products to be included.
|
|
|
|
Summary
Table: (Evaluations/Importance) Average
values of products /new concepts evaluations as well as measures of
importance. - Positioning |
Perceptual
Maps: (Evaluations/Importance) Shows
competitive position among products.
The vectors based on correlation (factors) – Positioning |
|
|
|
|
Importance Position: (Evaluations/
Importance) Shows differences
between derived and stated importance. - Positioning |
Customer Value Position: (Importance/Benefit
Value) Indicates concentration of customers and existence of major segments.
- Segmentation |
|
|
|
|
Product/Service-Supplier
Position: (Importance) Compares
product value importance with that of services. – Positioning |
Net
Promoter Index: (Evaluations)
Measures the relative willingness of
customers to recommend products. – Market Analysis |
|
|
|
|
Dynamic
Quadrant Maps:
(Evaluations/ Importance) Show the position of the attributes of
products by performance, importance and relative advantage against specific
competitor. –
Positioning, Six Sigma. |
Stated
Importance and Benefit Displays: (Importance/Conjoint) Shows the
distribution of the importance or benefit
value of two items with the identity of the respondent. – Sales Analysis |
|
|
|
|
Sources of
Information/ Key Influencers: (Demographics)
Shows the importance of the sources of information and key influencers for the
group of respondents selected. - Promotion |
Benefit/Feature
Value: (Conjoint)
The results of the perceived benefit and feature value are shown as
percentile and average values along with composite or bundle values.- Value
Analysis, Product Design |
|
|
|
|
Feature
Bundle Value Distribution: (Conjoint)
Shows the distribution of value of specific features/benefits and
combinations. Discounting of multiple
values is included as an option. Value analysis, Product Design |
Applications/Processes/Equipment
Used: (Demographics) The characteristics of
respondents’ operations are referred to as “Demographics” and are displayed
in terms of their occurrence or use level. - Positioning |
|
|
|
|
Competitive
Pricing Model: (Choice Price)
Competitive pricing is measured by the use of a
complete choice model from which interactive market price share and earnings
simulators are developed. –
Micro-Econometrics |
Demand and
Earnings Curves: (Choice
Price) Pricing profiles are generated using the competitive
pricing models indicating the demand and earnings curves along with
individual product optimum price ranges. – Micro-Econometrics |
|
|
|
|
Joint
Earnings: (Choice
Price) Where the firm has two products competing in a market
the joint earnings need to be considered in pricing. This is shown on this curve as a joint
earnings density map. – Micro-Econometrics |
Price
Elasticity: (Choice Model) Shows the relative change in demand with price across
key products. This indicates
differences in relative demand for the products at various prices. –
Micro-Econometrics |
|
|
|
|
Value
Line: (Choice Model) The “best” price for a product
reflects the position of various costs and value points. These are shown on this value line. – Value Analysis |
Strategic
Value Map: (Evaluation/Choice Price) Shows the strategic product position based
on a collective value (utility) and the price. The optimum price range is also shown to
indicate possible new directions. – Value Analysis |
|
|
|
|
Van
Westendorp Demand: (Price
Sensitivity) Concept testing focuses on the demand for a new concept against
all others at various prices. Van
Westendorp method captures extreme limits on pricing (too high and too low as
well as expectations. – Concept
Testing |
Concept
Demand & Earnings: (Concept
Pricing, Price Sensitivity) Combining both direct concept testing (given
prices) and Van Westendorp measures allow for development of a price model
based on the likelihood to purchase. – Concept Testing |
|
|
|
|
Traditional
Van Westendorp Curves: (Price
Sensitivity) Traditional Van Westendorp analysis focuses on the range of
acceptable prices as the interception of various demand curves for new
concepts. – Concept Testing |
Product
Awareness: (Demographics) Indicates the level (nature) of awareness by product
brand - Branding |
|
|
|
|
Awareness
Penetration: (Demographics) An alternative view of awareness is the degree of
“mind penetration”, that is the degree of cumulative awareness. - Branding |
Outcomes
Occurrence: (Outcomes) Outcomes are the uses and tasks for the products, The level of occurrence of the outcomes is
a key measure of importance – |
|
|
|
|
Outcomes
Positioning: (Outcomes Evaluations) Shows the three measures of
performance for outcomes: (1) stated importance, (2) incidence and (3)
difficulty of performance - |
Correlation
Map: (Evaluation) Shows the relative interrelationship among the measured
items including objectives. Colors indicate
underlying or latent variable groups. – Value Analysis |
|
|
|
|
Regression
Results: (Evaluations) Regression analysis is a strong measure of key driving
factors. Stepwise-Ridge versions
indicate major factors. – Value
Analysis |
Importance
vs. Dissatisfaction: (Evaluations) Shows the level of
dissatisfaction (performance below set-points) by product in order of
importance. – |
|
|
|
|
Pareto
Chart of Dissatisfaction: (Evaluations) Shows dissatisfaction by
product and level, displayed in order of level along with cumulative effect –
Six Sigma, |
One-by-One
Charts: (Evaluations/ Importance) Shows the relative average position of
products based on selected two variables; vector position of other variables
based on correlation - Position |
|
|
|
|
Strategic
Canvas: (Evaluation) Shows the relative value of performance features and
claims for groups of products organized in the attribute importance. – |
Operational
Beliefs & Risks: (Attitudes) Shows attributes as agreement
with statements. – Branding, SWOT Analysis |
|
|
|
|
Brand
Beliefs: (Attitudes) Shows brand perceived strengths and beliefs. Branding |
“ |
|
|
|
|
Attitudes
Evaluation: (Attitudes)
Shows the detailed attitude agreement for specific statements. – SWOT
Analysis |
Claims
Profiles: (Claims Evaluations) Shows the average claims performance by
product. Claims are simple clauses
asserting the value of a product.
Value propositions are constructed from these claims. - Branding |
|
|
|
|
Standardized
Segment Profiles: (Importance, Conjoint, Attitudes) Shows
the relative distinction among derived segments based on statistical cluster
analysis. Used to identify the nature
of the segments – Functional Segmentation |
Average
Value Segment Profiles: (Importance, Conjoint, Attitudes) Shows the actual
average values of segmentation criteria resulting from cluster analysis. Used to determine the distinction among
segments. – Functional Segmentation |
|
|
|
|
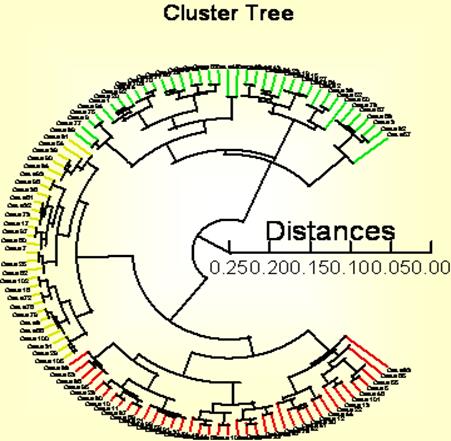
Cluster
Trees: (Importance, Conjoint, Attitudes) Shows the relative
distinction among respondents being clustered. Used to determine the effective number of
segments. – Functional Segmentation |
Current
& Future Features: (Feature Profiling) Shows the comparison
between current feature and brand selection that that preferred for the next
purchase. – Product Design |
|
|
|
|
Loyalty by
Brand: (Choice Pricing) Customer loyalty is estimated using the pricing
simulator based on the share of current customers that will repurchase the
brand. – Branding, Market Analysis |
Brands
Considered: (Brand Consideration) Shows the other brands that
will be considered beyond the current one.
This is an adjunct to the Brand Loyalty analysis showing the potential
range of action – Market Analysis |
|
|
|
|
Preferred
New Features: (Feature Profiling) Shows the preferred new product features along
with those features that are required (table stakes) and those that must not
be included - Product Design |
Product
Simulation: (Feature Profiling) The product simulator provides the expected
results of a choice among three hypothetical products based on feature
profiling. – Product Design |
|
|
|
|
Product
Simulation Results: (Feature Profiling) The results are
estimates of the shares that each hypothetical design should capture under
various |
Relative
Proportion Matrix: (Frequency Chart) The results show the
relative frequency of conditions. In
this case we view the purchase intent of customers by their age. |
|
|
|
|
|
|
|
Dynamic Positioning: (Performance
Tracking) This indicates the dynamic position of products or groups. The axes are either key variables or combinations
based on statistical compression ( CDS |
Price Estimate Smoothing: (Van
Westendorp) The estimates of target pricing from Van Westendorp exercises can
vary widely. If assume that the
expansive estimates (too expensive, too low, bargain) are functions of the
expected value then outliners can be identified and the data smoothed. This type of graph shows that analysis and
indicator of the stability of the data. For more information on developing Your-Marketing-Toolkits: Eugene B. Lieb Custom Decision Support, LLC (831) 854-2256 |
|
© Copyright Custom Decision Support, LLC (2008,
2012) |
|