 |
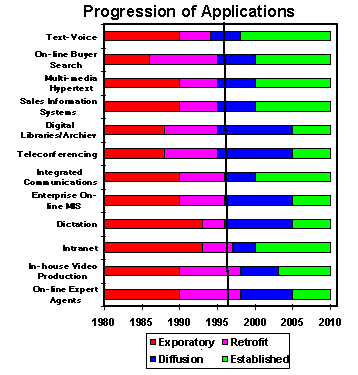
Technology has two edges. It is the promise and opportunity for the future; but also threatens the present world. How to respond to technology is the ever present dilemma. This has become particularly true for information technology. Too early adoption results in high costs and low performance often without any compensating reward. Too late and we lose any competitive advantage. The appropriate choice of when to adopt depends on the specific needs of the organization and the speed of change in that technology. We have found it useful to think of applications of technology as going through four phases; each with specific advantages and costs for the adopters.
| The innovative phase of new applications is the most exciting for researchers, but very expensive. This is the world of the pioneers. There are few standards and development tools are primitive or non-existent. This is the world of the highly skilled specialists. The value of adoption during this phase is the command of technology. If the technology and the application are within the core competency of the organization then it might be worth the risk to become a pioneer. | |
| At some point, applications become well identified and early adopters can implement the technology. Characteristically, technology is applied to existing problems. Here the technology is "retrofitted" to the present world. Technology is still expensive but for critical tasks it is usually affordable. Competitive advantage can be obtained by providing quality and services that competitors can not match. However, return from the technology is limited by the installed base of resources and people. | |
| With a large installed base of the technology, there is a diffusion of new applications. The cost of the technology decreases significantly with increase scale of use. The value of the technology expands with applications; inducing early followers to adopt the technology. There is commercial support for the applications as well as strong competition among vendors. | |
| Eventually the technology becomes ubiquitous; it is everywhere. It becomes so well established that it can be assumed that it is always used. Not to adopt the technology is to become non-competitive. Here even the most late followers adopt the technology. |
While we think of these phases as being sequential, in reality they do overlap. The accompanying figure shows our estimates of the timing of phases of some information technologies. More details are available as presentation notes. See the request form at the end of the newsletter.
 |
The impact of new market entries is one of the most difficult events to forecast. However, research has provided some insight into the behavior of market shares. Many markets tend to have stable shares. This stability is analogous to a "Quantized" or fixed state. It takes a great deal of effort to change position and share. We have found that market shares, in this type of market, are expected to follow a rank ordered distribution referred to as the "Broken Stick Rule." While not all markets show this type of behavior, it is common enough to be used as a basis of comparison and the "best guess" estimate of future market shares.
The "Broken Stick Rule" is among the simplest rank ordered distributions and is based on random sampling of a fixed linear measure. It is equivalent to taking a large number of fixed length sticks; randomly breaking them up into a number of parts; ranking the parts from each stick and computing the average size of each group. The average distribution from this process for four segments is 52%, 27.1%, 14.6% and 6.3%. Some supporting evidence can be seen in the shares of the US automotive market in 1967, before the entry of strong foreign competition. The shares of General Motors, Ford, Chrysler and American Motors were 52%, 27%, 14.5% and 6.5%.
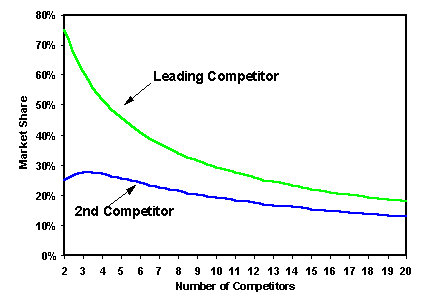
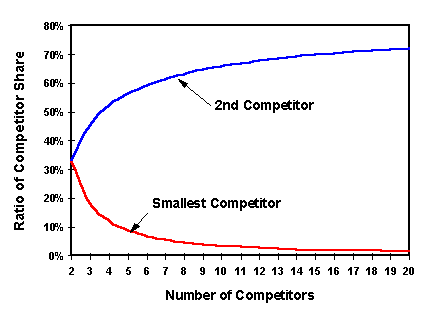
With quantized markets the impact of competitive entry and exit can be estimated as well as the difficulty of changing market position. Market leadership is shown to be particularly sensitive to the entry of competitors. The second market position, however, appears to be stable under these conditions. In limited competitive markets, with less than eight competitors, the second largest competitor's share varies only between 23% and 28%. The market leader, however, shows a vast change in share, ranging between 75% for two competitors and 37% with seven competitors. The stability of the second position may offer a strategic advantage with potential pricing implications in relationship to the market leader.
 |
 |
Modern electronic spreadsheets have a wealth of built in capabilities. Microsoft EXCEL has a huge number of statistical and application functions readily available. As with many things in life, you occasionally need a function that is not available. This is the case of the Broken Stick Rule for computing ideal market shares. This rank order statistical distribution is not available in EXCEL. However, EXCEL, version 5, has the capability of including user specified functions. Developing new functions require using the macro language VisualBASIC for applications in EXCEL. This is easier than it sounds, if you are familiar with simple computer programming. Unlike other VisualBASIC procedures, developing functions use only conventional BASIC programming statements. Let us start by defining the Broken Stick Share Distribution of the form given the number of competitors and their rank:
Share (Number, Rank) =

To make an EXCEL function, first you need to open a MODULE sheet using the commands Insert/Macro/Module. Then supply type in the following BASIC program.
Function BSTICK(NUMBER, RANK)
BSTICK = 0
For I = NUMBER To RANK Step -1
BSTICK = BSTICK + (1 / I)
Next I
BSTICK = (1 / NUMBER) * BSTICK
End Function
Notice that this uses only traditional program-ming statements. Other functions can be defined similarly on the same Module worksheet.
A "system" approach to dynamic modeling has promised insight into the future since the early 1960's Club of Rome world forecasts. PowerSim is the latest in a line of dynamic simulation packages designed to facilitate the construction of these models from flow or influence diagrams. iThink is an older system originally available for the MacIntosh and now redesigned for business and process re-engineering applications. Both are available as Windows applications.
Spreadsheet models as well as dedicated programs can be used to build dynamic simulators. However, neither provide a graphic interface for model development. The process of model development is fairly involved. The graphic interface is useful and as such PowerSim and iThink provide means to involve business teams in model development. However, like other general simulators, these packages are not designed for the novice user. Significant effort is necessary to become familiar with the modeling approach and the tools in the package. Both are strictly a deterministic dynamic simulator. They are not directly able to do either risk analysis or optimization. The packages are fairly inexpensive. We recommend either one as a resource rather than a standard business model development tool.
PowerSim is published by ModellData and iThink is published by High Performance Systems, Inc. Both are distributed by Palisade Corporation, Newfield, NY 14867, and through SciTech International.
This is our fourth newletter. I hope that the articles in the newsletter stimulate discussion and provide some new insights into planning for the future. Future newsletters are planned to include articles on: (1) modeling markets, (2) mining customer satisfaction data, (3) the structure of the material industry, and (4) pricing policy. I appreciate any comments and contributions from you. You can get in touch with me at Custom Decision Support, Inc., Phone (610) 793-3520. Fax (610) 793-2531 or E-Mail at genelieb@lieb.com.